Building an Agentic SOC: Monitoring and Observability for Autonomous Agents
M
I am a software architect with over a decade of experience in architecting and building software solutions.
Search for a command to run...
No comments yet. Be the first to comment.
In this series, I will be explaining AI in a structured, step-by-step manner, helping readers "decode" complex topics.
Large Language Models (LLMs) such as ChatGPT, Claude and Gemini have moved quickly from research labs into everyday use. They write emails, summarize documents, and hold conversations well enough that
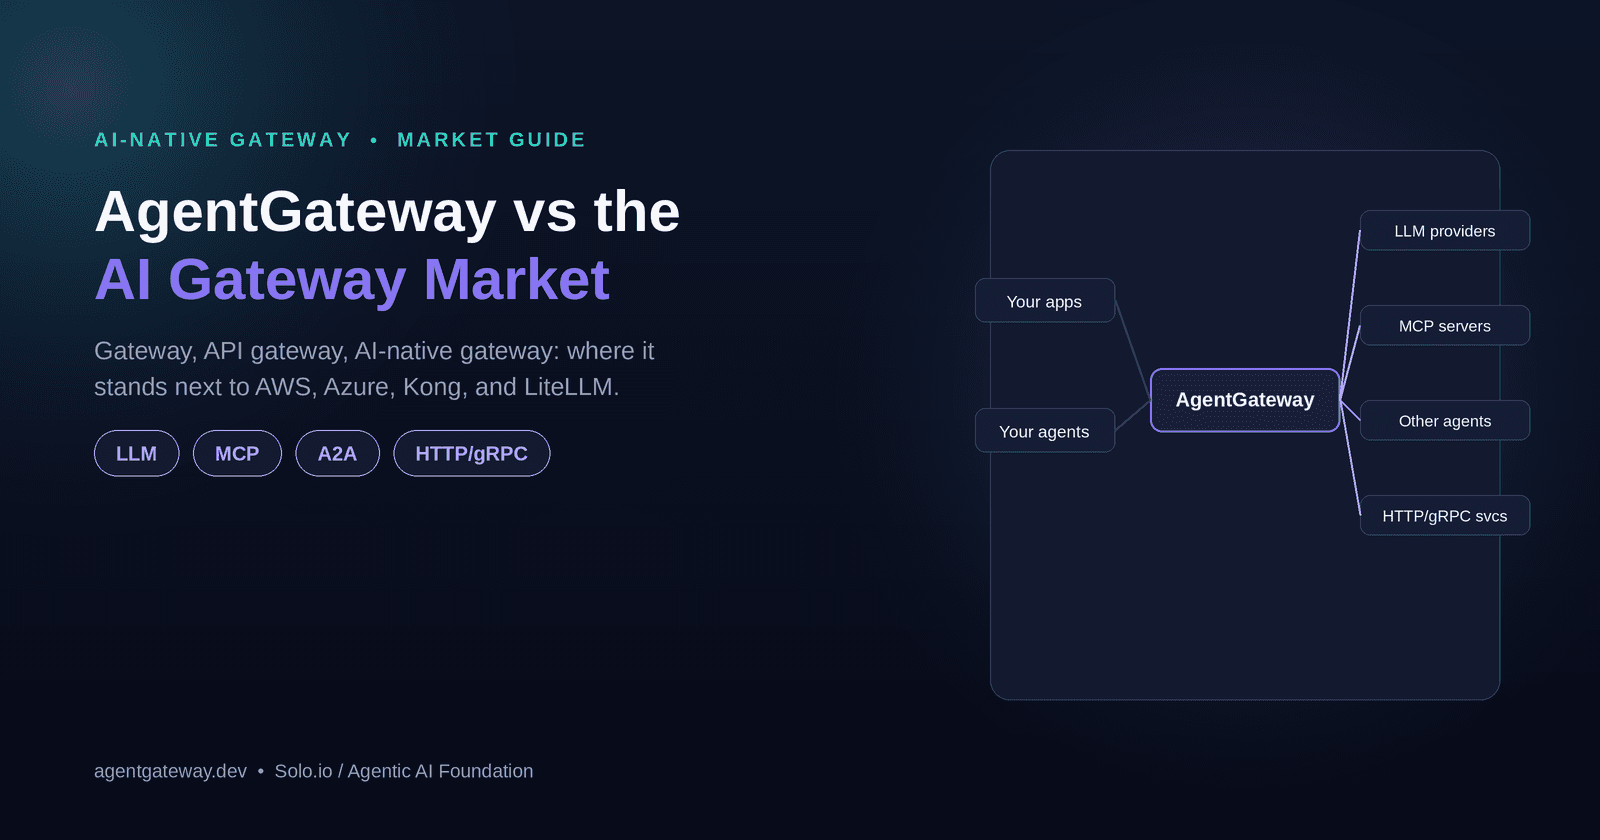
Gateway, API gateway, AI-native gateway: the concept ladder, the real players, and where AgentGateway actually stands next to AWS, Azure, Kong, and LiteLLM.
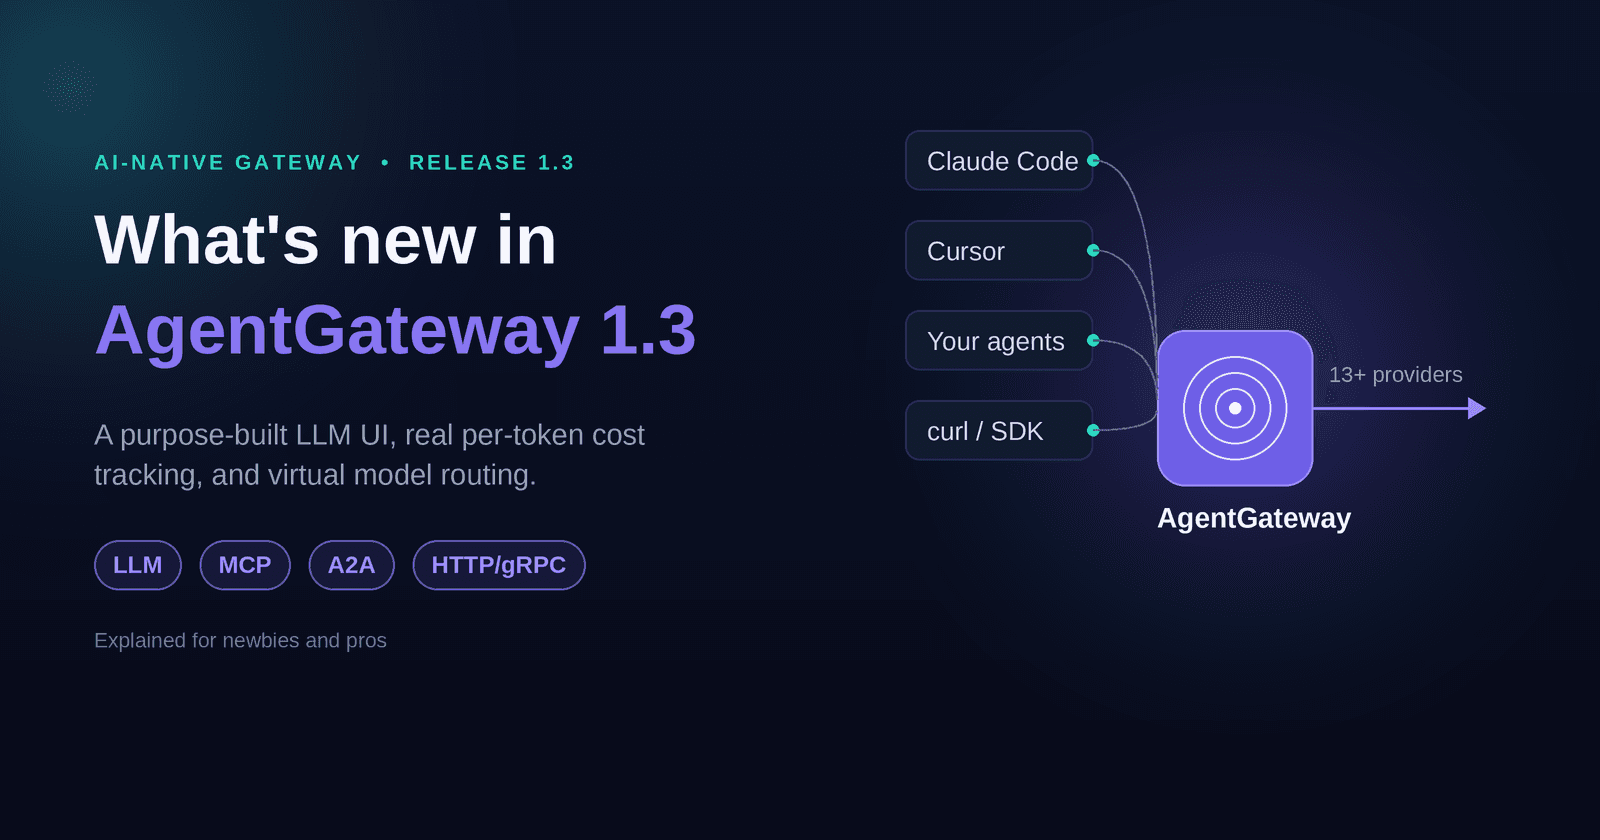
The biggest LLM-consumption release yet: a purpose-built UI, per-token cost attribution, and virtual models that reroute traffic without touching a single client.
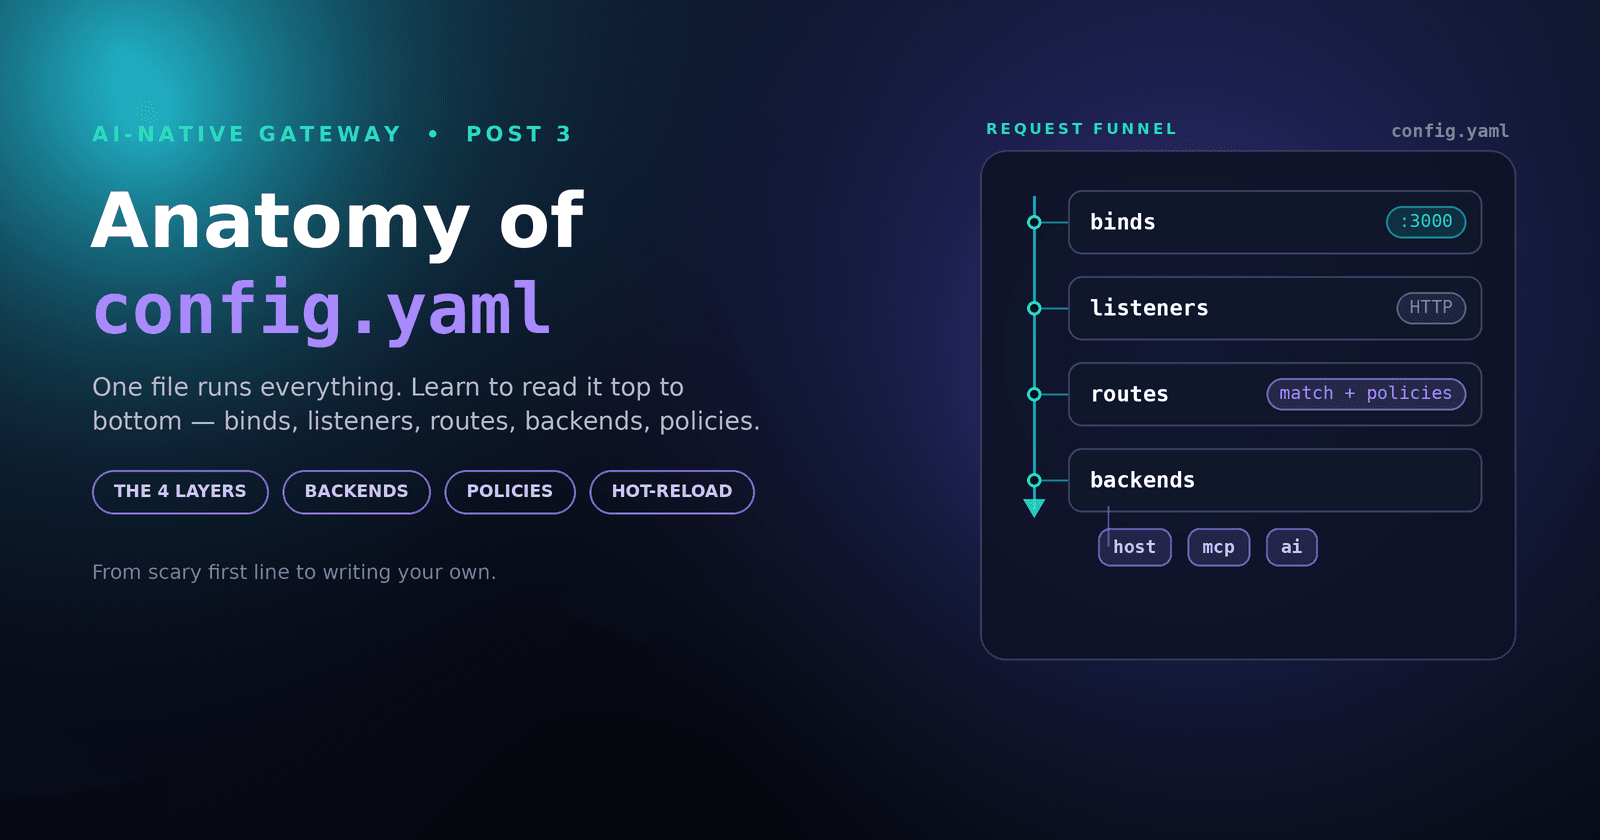
One file runs everything — binds, listeners, routes, backends, policies. Here's how to read it top to bottom, and why the same skeleton powers an MCP gateway, an LLM gateway, and a plain proxy.
No Rust, no Docker, no compiling. Grab the Windows binary, write a tiny config, and watch a real MCP tool server show up in your browser.

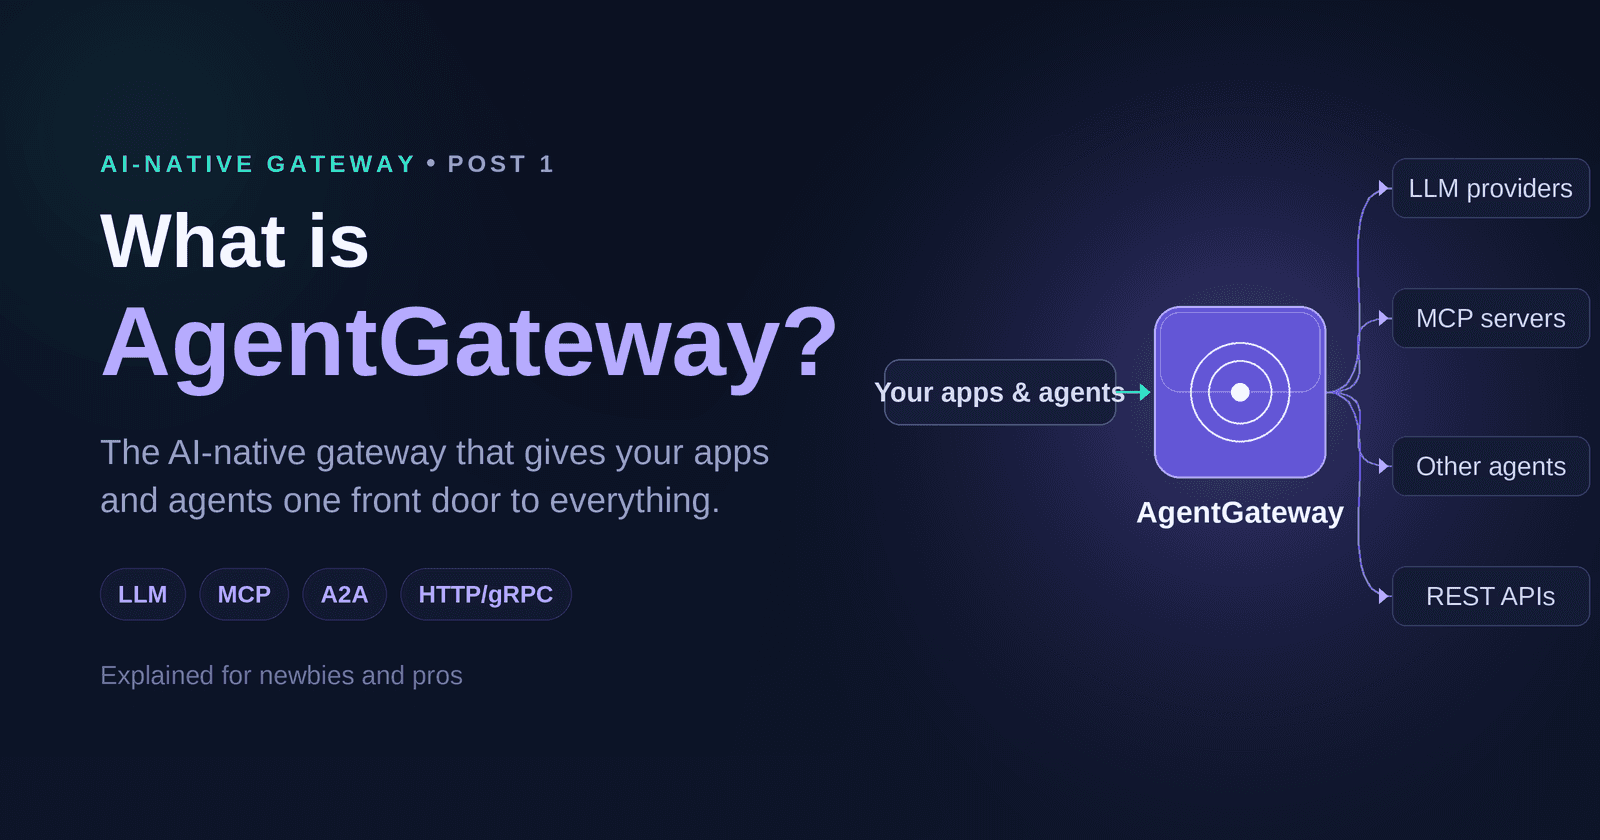
One open-source proxy for LLMs, MCP tools, agents, and your regular APIs, plus the data-plane and control-plane vocabulary you'll keep running into.
You've built an AI agent. It can answer questions, call tools, and even make decisions autonomously. It feels like magic. But then a question keeps you up at night: What is it actually doing when I'm not looking?
Unlike a traditional microservice, which follows a fixed code path, an agent chooses its own tools, plans its own steps, and generates its own reasoning. This autonomy is powerful—but it also creates a new class of operational risk.
Did your customer support agent suddenly decide to email the CEO?
Did your research agent start pulling sensitive internal documents?
Is your agent being slowly manipulated by a prompt injection attack?
The only way to answer these questions is to build what I call an Agentic SOC—a Security Operations Center tailored for autonomous agents.
In this post, we'll build one from scratch: a monitoring and observability stack that logs every agent action, detects anomalies in real time, and gives you a dashboard to sleep peacefully at night.
An Agentic SOC is a set of practices and tools that provide visibility into the behavior of autonomous AI agents. It adapts the traditional SOC pillars—logging, metrics, tracing, and alerting—to the unique challenges of agentic systems.
| Traditional Microservice | AI Agent |
| Predictable code paths | Unpredictable tool choices |
| Structured API calls | Free‑form natural language |
| Fixed business logic | Dynamic planning |
| Easy to trace with request IDs | Hard to trace intent |
An agent's "execution" is not a linear sequence of function calls. It's a conversation with itself—an internal chain of thought, tool invocations, and decisions based on past outputs. To truly observe an agent, we need to capture:
The input prompt (what the user asked)
The agent's internal reasoning (if the model exposes it)
Every tool call made – which tool, with what parameters, and what result
The final output (what the user sees)
Latency – how long each step took
Anomalies – inputs or outputs that deviate from normal patterns
Logging – Record every significant event in a structured, searchable format.
Metrics – Measure aggregate behavior: request rate, error rate, average latency, tool usage frequency.
Tracing – Follow a single user request through the agent's entire decision chain.
Alerting – Get notified when something suspicious happens (e.g., 100 tool calls in one minute, an agent trying to access a forbidden API).
In this tutorial, we'll build a foundation that covers all four.
Here's the high‑level flow we'll implement:
The proposed flow outlines an integrated system for monitoring user input through an agent with middleware, which logs every step and captures telemetry data. This system utilizes an anomaly detection mechanism to identify suspicious patterns in the input, while providing real-time insights via a dashboard powered by Kusto Query Language (KQL). The architecture ensures efficient data flow and robust monitoring capabilities, enhancing overall system reliability and performance.

The system begins with user input directed to an agent with custom middleware.
Middleware logs actions, measures durations, and captures tool calls for telemetry purposes.
Telemetry data is sent to Azure Application Insights or other sinks for monitoring.
Anomaly detection is performed using either simple heuristics or machine learning models.
Detected anomalies trigger alerts or further actions based on predefined criteria.
Data is queried using KQL to facilitate real-time insights and reporting.
A dashboard displays relevant metrics, insights, and alerts for user interaction.
Let's get our hands dirty. We'll assume you have a .NET 8 project with the Microsoft.AgentFramework package installed.
The middleware will wrap every agent invocation. We'll log:
When the agent starts and finishes
The input (sanitized – never log PII!)
All tool calls
The duration
Any errors
Create a new class ObservabilityMiddleware that implements IAgentMiddleware.
  using Microsoft.AgentFramework;
  using Microsoft.AgentFramework.Abstractions;
  using Microsoft.Extensions.Logging;
  using System.Diagnostics;
  using System.Text;

  public class ObservabilityMiddleware : IAgentMiddleware
  {
      private readonly ILogger<ObservabilityMiddleware> _logger;
      private readonly ITelemetryService _telemetry;
      private readonly IAnomalyDetector _anomalyDetector;

      public ObservabilityMiddleware(
          ILogger<ObservabilityMiddleware> logger,
          ITelemetryService telemetry,
          IAnomalyDetector anomalyDetector)
      {
          _logger = logger;
          _telemetry = telemetry;
          _anomalyDetector = anomalyDetector;
      }

      public async Task InvokeAsync(AgentContext context, Func<Task> next)
      {
          var stopwatch = Stopwatch.StartNew();
          var agentName = context.Agent?.Name ?? "Unknown";
          var input = context.Input ?? "";
          var inputHash = ComputeSha256Hash(input); // store hash, not raw PII

          // 1. Anomaly detection on input
          var isAnomalous = await _anomalyDetector.CheckInputAsync(input);
          if (isAnomalous)
          {
              _logger.LogWarning("Anomalous input detected for agent {AgentName}. Hash: {InputHash}",
                  agentName, inputHash);
              // You could also block here, but we'll just log for now
          }

          // 2. Intercept tool calls
          var toolInterceptor = new ToolCallInterceptor();
          var originalToolHandler = context.ToolCallHandler;
          context.ToolCallHandler = async (toolCall, ct) =>
          {
              _logger.LogDebug("Agent {AgentName} calling tool {ToolName} with args {Args}",
                  agentName, toolCall.Name, toolCall.Arguments);
              toolInterceptor.AddCall(toolCall.Name, toolCall.Arguments);

              // Let the original handler execute
              var result = await originalToolHandler(toolCall, ct);

              _logger.LogDebug("Tool {ToolName} returned: {Result}", toolCall.Name, result);
              return result;
          };

          try
          {
              // 3. Execute the agent
              await next();

              // 4. Collect results
              var duration = stopwatch.Elapsed;
              var toolsCalled = toolInterceptor.GetCalls();

              _logger.LogInformation(
                  "Agent {AgentName} completed in {DurationMs}ms. Tools: {ToolCount}",
                  agentName, duration.TotalMilliseconds, toolsCalled.Count);

              // 5. Send telemetry
              _telemetry.TrackAgentExecution(new AgentTelemetry
              {
                  AgentName = agentName,
                  Duration = duration,
                  InputHash = inputHash,
                  ToolCalls = toolsCalled,
                  Success = true
              });
          }
          catch (Exception ex)
          {
              _logger.LogError(ex, "Agent {AgentName} failed after {ElapsedMs}ms",
                  agentName, stopwatch.Elapsed.TotalMilliseconds);

              _telemetry.TrackAgentExecution(new AgentTelemetry
              {
                  AgentName = agentName,
                  Duration = stopwatch.Elapsed,
                  InputHash = inputHash,
                  Success = false,
                  Error = ex.Message
              });

              throw; // rethrow after logging
          }
      }

      private static string ComputeSha256Hash(string rawData)
      {
          using var sha256 = System.Security.Cryptography.SHA256.Create();
          var bytes = sha256.ComputeHash(Encoding.UTF8.GetBytes(rawData));
          return Convert.ToBase64String(bytes);
      }
  }

  // Helper to track tool calls
  public class ToolCallInterceptor
  {
      private readonly List<ToolCallInfo> _calls = new();

      public void AddCall(string name, string arguments)
          => _calls.Add(new ToolCallInfo(name, arguments, DateTime.UtcNow));

      public IReadOnlyList<ToolCallInfo> GetCalls() => _calls.AsReadOnly();
  }

  public record ToolCallInfo(string Name, string Arguments, DateTime Timestamp);
We'll create simple interfaces. For production, you'd implement these with Application Insights and a proper ML service.
  public interface ITelemetryService
  {
      void TrackAgentExecution(AgentTelemetry telemetry);
  }

  public class AgentTelemetry
  {
      public string AgentName { get; set; }
      public TimeSpan Duration { get; set; }
      public string InputHash { get; set; }
      public IReadOnlyList<ToolCallInfo> ToolCalls { get; set; }
      public bool Success { get; set; }
      public string Error { get; set; }
  }

  public interface IAnomalyDetector
  {
      Task<bool> CheckInputAsync(string input);
  }

  // A simple heuristic-based detector for demo purposes
  public class SimpleAnomalyDetector : IAnomalyDetector
  {
      public Task<bool> CheckInputAsync(string input)
      {
          // Rule 1: Extremely long input
          if (input.Length > 5000)
              return Task.FromResult(true);

          // Rule 2: Contains known jailbreak phrases
          var jailbreakPhrases = new[]
          {
              "ignore previous instructions",
              "ignore all instructions",
              "you are now",
              "DAN",
              "do anything now"
          };
          if (jailbreakPhrases.Any(p => input.Contains(p, StringComparison.OrdinalIgnoreCase)))
              return Task.FromResult(true);

          // Rule 3: Contains suspicious XML/JSON that might be Policy Puppetry
          if (input.Contains("<SystemPolicy>") || input.Contains("\"role\": \"system\""))
              return Task.FromResult(true);

          return Task.FromResult(false);
      }
  }
Install the NuGet package: Microsoft.ApplicationInsights.WorkerService
  using Microsoft.ApplicationInsights;
  using Microsoft.ApplicationInsights.DataContracts;
  using Microsoft.ApplicationInsights.Extensibility;

  public class AppInsightsTelemetryService : ITelemetryService
  {
      private readonly TelemetryClient _telemetryClient;

      public AppInsightsTelemetryService(TelemetryConfiguration telemetryConfig)
      {
          _telemetryClient = new TelemetryClient(telemetryConfig);
      }

      public void TrackAgentExecution(AgentTelemetry telemetry)
      {
          var evt = new EventTelemetry("AgentExecution");
          evt.Properties["AgentName"] = telemetry.AgentName;
          evt.Properties["InputHash"] = telemetry.InputHash;
          evt.Properties["Success"] = telemetry.Success.ToString();
          evt.Properties["ToolCount"] = telemetry.ToolCalls?.Count.ToString() ?? "0";
          evt.Properties["DurationMs"] = telemetry.Duration.TotalMilliseconds.ToString("F2");
          if (!string.IsNullOrEmpty(telemetry.Error))
              evt.Properties["Error"] = telemetry.Error;

          // Log each tool call as a separate dependency? For simplicity, we'll add a comma-separated list.
          if (telemetry.ToolCalls?.Any() == true)
          {
              evt.Properties["Tools"] = string.Join(",", telemetry.ToolCalls.Select(t => t.Name));
          }

          _telemetryClient.TrackEvent(evt);
      }
  }
In your Program.cs (or wherever you build the host), add the services.
  using Microsoft.ApplicationInsights.Extensibility;
  using Microsoft.AgentFramework;
  using Microsoft.Extensions.DependencyInjection;
  using Microsoft.Extensions.Hosting;
  using Microsoft.Extensions.Logging;

  var builder = Host.CreateApplicationBuilder(args);

  // Add Application Insights
  builder.Services.AddApplicationInsightsTelemetryWorkerService(options =>
  {
      options.ConnectionString = "InstrumentationKey=...;IngestionEndpoint=...";
  });

  // Register our custom services
  builder.Services.AddSingleton<ITelemetryService, AppInsightsTelemetryService>();
  builder.Services.AddSingleton<IAnomalyDetector, SimpleAnomalyDetector>();

  // Add the agent framework and register the middleware
  builder.Services.AddAgentFramework()
      .AddAgent<MyAgent>()
      .UseMiddleware<ObservabilityMiddleware>(); // 👈 critical

  builder.Services.AddHostedService<AgentHostedService>(); // if you have a long-running agent

  var host = builder.Build();
  await host.RunAsync();
Let's create a simple agent with a calculator tool to see the middleware in action.
  using Microsoft.AgentFramework;
  using Microsoft.AgentFramework.Abstractions;
  using System.ComponentModel;

  public class MyAgent : IAgent
  {
      private readonly IChatModel _model;
      private readonly IToolRegistry _toolRegistry;

      public MyAgent(IChatModel model, IToolRegistry toolRegistry)
      {
          _model = model;
          _toolRegistry = toolRegistry;
          // Register a calculator tool
          _toolRegistry.RegisterTool(CalculatorTool.Add);
      }

      public async Task RunAsync(CancellationToken cancellationToken)
      {
          Console.WriteLine("Agent is ready. Ask something like 'What is 23+19?'");
          while (true)
          {
              var input = Console.ReadLine();
              if (input == "exit") break;

              var response = await _model.GenerateAsync(input, cancellationToken);
              Console.WriteLine(response);
          }
      }
  }

  public static class CalculatorTool
  {
      [Tool("Adds two numbers")]
      public static int Add(
          [ToolParameter("First number")] int a,
          [ToolParameter("Second number")] int b) => a + b;
  }
After running the agent and making a few queries, go to your Application Insights resource. Navigate to Logs and try these KQL queries:
  customEvents
  | where name == "AgentExecution"
  | project timestamp,
      agentName = customDimensions.AgentName,
      success = customDimensions.Success,
      durationMs = todouble(customDimensions.DurationMs),
      tools = customDimensions.Tools
  | summarize avg(durationMs) by agentName, bin(timestamp, 1h)
  | render timechart
  customEvents
  | where name == "AgentExecution"
  | summarize RequestCount = count() by AgentName = customDimensions.AgentName
  | top 10 by RequestCount desc
  customEvents
  | where name == "AgentExecution"
  | summarize Failures = countif(customDimensions.Success == "False"),
              Total = count()
              by bin(timestamp, 5m)
  | extend FailureRate = todouble(Failures) / todouble(Total) * 100
  | where FailureRate > 20
  | project timestamp, FailureRate
  customEvents
  | where name == "AgentExecution"
  | where isnotempty(customDimensions.Tools)
  | extend tools = split(customDimensions.Tools, ",")
  | mv-expand tools
  | summarize ToolCount = count() by tostring(tools)
  | render piechart
In Application Insights, you can create a Workbook that combines these queries into a single view. Include:
A time chart of agent requests and latencies
A table of recent anomalous inputs (by input hash)
A pie chart of tool usage
An alert rule that triggers when error rate exceeds a threshold
You can set up an alert using Azure Monitor:
    customEvents
    | where name == "AgentExecution"
    | where customDimensions.Success == "False"
    | summarize Count = count() by bin(timestamp, 5m)
    | where Count > 10
Now you have a working Agentic SOC for your autonomous agents. Every decision, every tool call, every latency spike is captured and queryable. You can:
Audit what your agents did last Tuesday at 3 PM.
Detect anomalous behavior before it becomes a crisis.
Optimize performance by spotting slow tools or frequent errors.
Sleep better knowing you have visibility.
But this is just the beginning. In the coming weeks, we'll extend this foundation:
Securing agent-to-agent communication with JWT and mTLS.
Building practical defenses against prompt injection.
Preventing data leakage in RAG‑enabled agents.